matplotlib基础
1.基本绘图
控制颜色
颜色之间的对应关系为
b—-blue
c—-cyan
g—-green
k——black
m—-magenta
r—-red
w—-white
y——yellow表示颜色的方式:
a:用全名
b:16进制如:#FF00FF
c:RGB或RGBA元组(1,0,1,1)
d:灰度强度如:‘0.7’
控制线型
- 符号和线型之间的对应关系
- 实线
— 短线
-. 短点相间线
: 虚点线
- 实线
控制标记风格
- 标记风格有多种:
. Point marker
, Pixel marker
o Circle marker
v Triangle down marker
^ Triangle up marker
< Triangle left marker
> Triangle right marker
1 Tripod down marker
2 Tripod up marker
3 Tripod left marker
4 Tripod right marker
s Square marker
p Pentagon marker
* Star marker
h Hexagon marker
H Rotated hexagon D Diamond marker
d Thin diamond marker
| Vertical line (vlinesymbol) marker
_ Horizontal line (hline symbol) marker
+ Plus marker
x Cross (x) marker
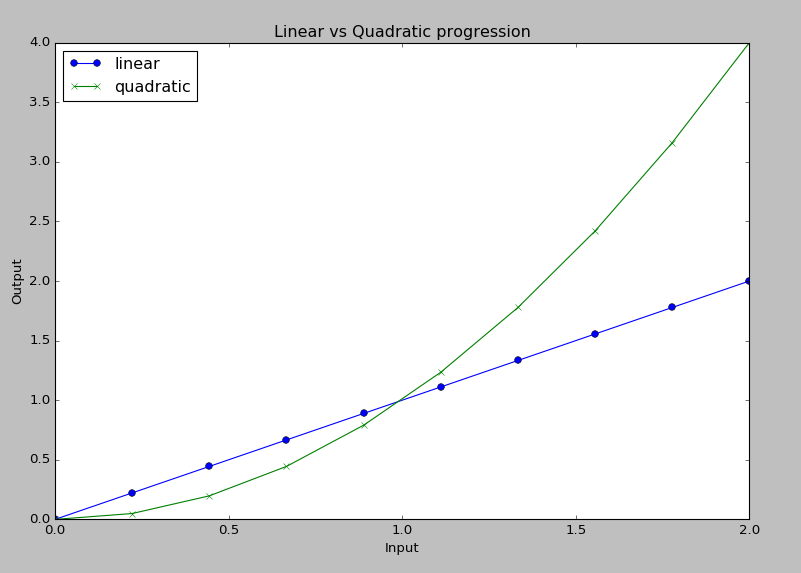
示例代码
1 | import pandas as pd |
生成结果
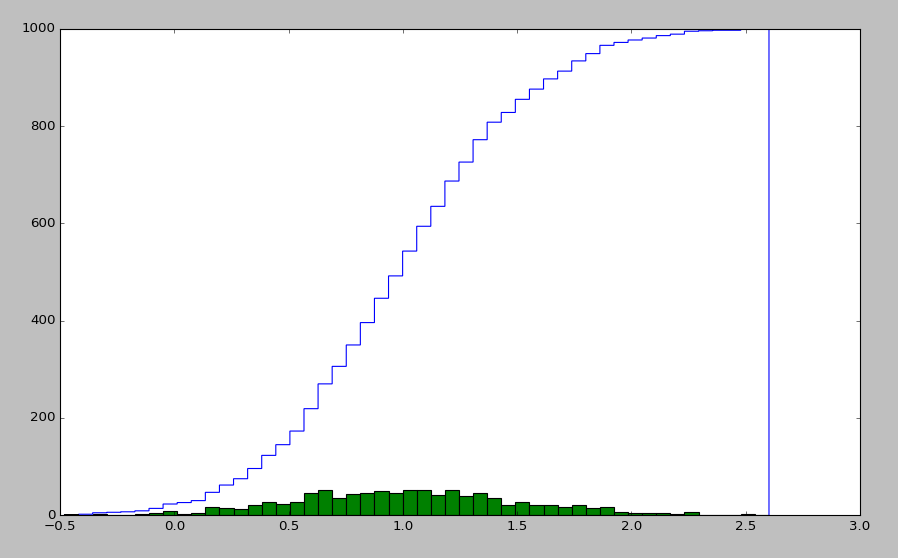
2.直方图
API
1 | matplotlib.pyplot.hist( |
示例代码
1 | samples = np.random.normal(loc=1.0, scale=0.5, size=1000) |
生成结果
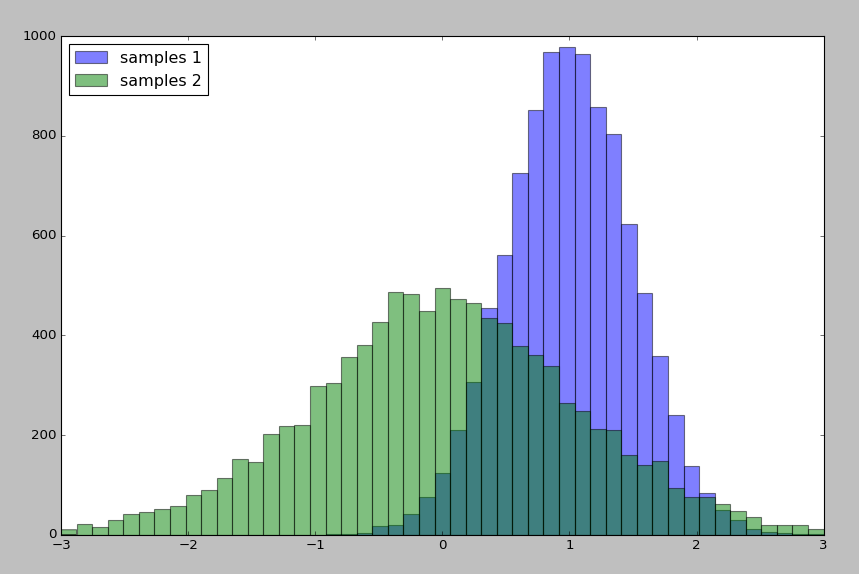
3.双直方图
示例代码
1 | samples_1 = np.random.normal(loc=1, scale=.5, size=10000) |
生成结果
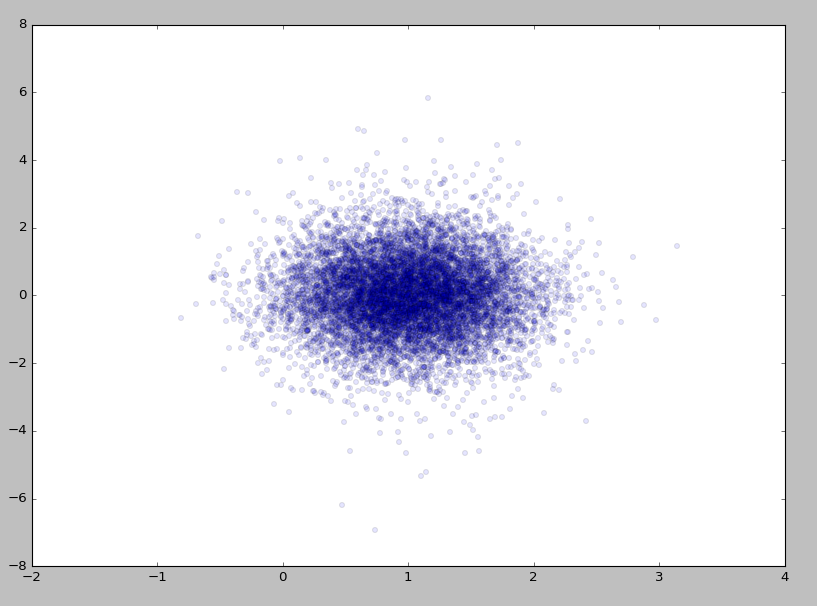
4.散点图
API
1 | matplotlib.pyplot.scatter( |
示例代码
1 | plt.scatter(samples_1, samples_2, alpha=0.1); |
示例代码
5.参考
[1] http://blog.csdn.net/kkxgx/article/details/6951959
[2] http://nbviewer.ipython.org/github/donnemartin/data-science-ipython-notebooks/blob/master/matplotlib/matplotlib.ipynb